Why I Don't Track Defect Velocity
I’m often asked if we should assign story points to defect work, and in response I proudly assert that teams should not. Of course the follow up question is inevitable and you and I both know what it is: “Why wouldn’t you? I mean it’s work being done by the team right?”
Well, there are several reasons you wouldn’t, and maybe I’ll talk about all of them at some point. For today, however, I will talk about only one reason: Uncovering systemic project issues.
Before we get too deep into the discussion, let’s review burn-down and burn-up charts.
In the early days we used burn-down charts to track our progress on a project and it worked pretty well. Well, at least until it didn’t. What we found was that the burn-down lied to us a bit. Actually, that may be a bit too harsh, it didn’t lie, it just misled us a bit. To see this in action, consider the following two 1000 point projects and take a look at the following burn-down charts.
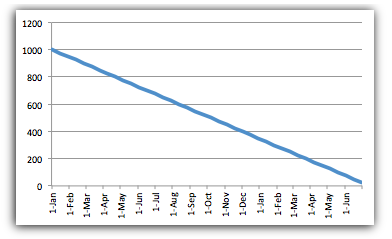
In this chart we can see that the development team had a consistent sprint velocity of 25 points per sprint. When the team’s velocity decreases, the slope of the burn-down will decrease, showing a delay in the project due to a decrease in the team’s capacity to deliver.
Now consider another scenario
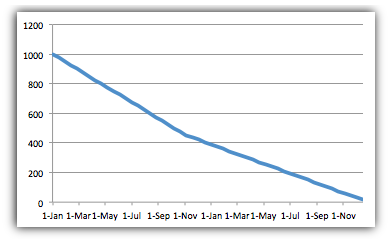
Looking at this burn-down, we can see that around November the slope of the line decreases. The chart shows us that the project completion date is moving out, but why? In this case, upon closer inspection, we would see that the team’s velocity is still at a consistent 25 points so the problem isn’t diminishing team capacity at all. What is the problem then? In this case, the problem is that, starting in November, the total project scope was increasing, that is 10 points per sprint were being added to the project. The burn-down chart made determining whether this was a scope problem or a capacity problem more difficult.
Some enterprising folks found a way to deal with this issue, and they called it a burn-up chart. By inverting the process and accumulating total work completed and total scope as independent variables we can show the differences more easily as you can see in the following example:
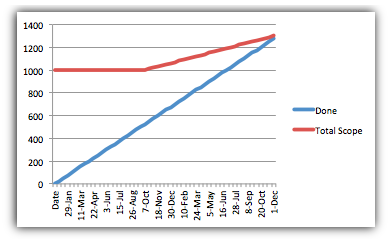
This chart shows the exact same project data as before, but projected as a burn-up instead. Now at a single glance, we can see that the delay in the project completion date is not due to a lack of capacity, but rather an increase in scope and we can adjust accordingly.
Fine, you say, but what about story pointing defects? after all that’s what you promised to talk about… Now that we understand how the burn-down can mislead us, and how we can reduce the confusion using a burn-up chart, we can turn our attention to those pesky defects.
Let’s assume you are humming along mid-project and you start to see some defects rolling in at the rate of 10 points worth per sprint. Using conventional wisdom, since it is work that needs done, we need to point the work and prioritize it. At first blush this makes sense but, after visualizing in the form of a burn-up, we see something different emerge. Take a look at the following burn-up chart. Based on our discussion above, what would you describe as a cause of project delay?
Compare the burn-up above with the first burn-up we saw. Notice the difference? There is none. Based on what we learned about burn-ups previously, this leads us to believe that we have a scope problem. Scope continues to increase while velocity remains constant.
Alas, we don’t have a scope problem here. What we have here is a quality problem masquerading as a scope problem. The development team is allowing defects to escape the sprints and make it out in the wild.
What happens if we defy conventional wisdom and refuse to point defects? What would the burn-up tell us? As you can see by the following burn-up chart, the defects have manifested themselves as reduced velocity.
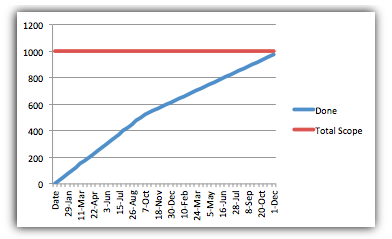
This again shows the date slipping, but this time it leads us to a different conclusion: The team is performing at a reduced capacity. Now, however, we can immediately see it for what it is. Popping the why stack and using proper retrospectives will help the team work through the defect issues and hopefully get this project back on track.